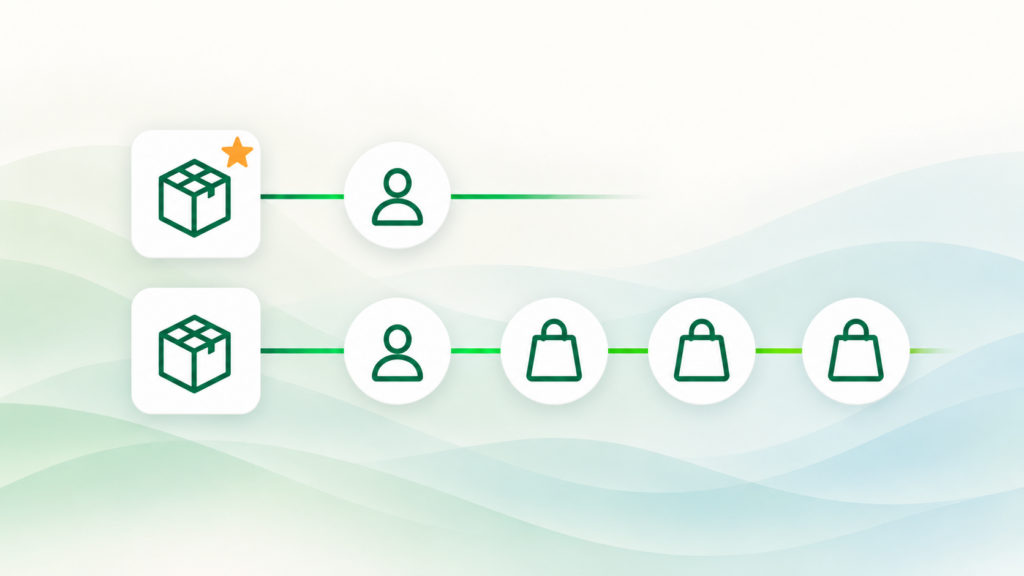
The vast majority of D2C businesses build their business model on retention, meaning customers coming back. They try to build a relationship with the customer by delivering a better product, one that is more tailored to the customer or made ethically. This lets them compete with the usually cheaper alternatives offered by big brands and corporations.
Such products have to be considerably more expensive, though. Convincing and therefore acquiring a customer is also harder and more expensive. The assumption, however, is that once a customer is convinced, they will stay for years.
Unless you sell floor tiles, bathroom fittings or beds, your business most likely has retention potential. In that case, optimizing for ROAS (return on ad spend) hurts you more than it helps. It is not the right approach. You should optimize for LTV/CAC.
Why the ad platform shows a great ROAS while the business isn’t growing
ROAS shows how well we monetize orders. It adds up orders from new and returning customers into one number and compares it to marketing costs. For D2C (retention) businesses it has a big problem: it limits growth. To grow efficiently, a business has to acquire new customers through paid activities and expand its customer base, while free or low-cost activities such as marketing automation generate repeat purchases. ROAS, however, will always be higher on returning customers. With a good product and an established relationship, they are easier and cheaper to convince to buy again.
The algorithm in the ad platform gets a ROAS target and delivers it exactly as it was set: in the easiest way possible. Most often by monetizing existing customers. The better your customer base, the faster an acquisition campaign turns into a campaign aimed at existing customers.
One of the campaigns we analyze at Sublime had a ROAS of 7. It looks like a dream result – until you work out that 97-98% of its orders came from customers who had bought before, and the cost of acquiring a genuinely new customer in that account reached PLN 4,000. No customer will generate a margin that pays back that cost.
“We over-optimized on performance and we can’t go on like this any longer,” the owner of the business summed up.
This is an extreme case of a simpler mechanism: ROAS counts the order. In a business customers come back to, what counts is how much they will spend in the months that follow – and ROAS can’t see that.
The customer base also has limited capacity: when a customer stocks up for a quarter, they won’t buy anything else for that quarter. Growth comes from new customers, and in a retention business ROAS works best as a cash flow safeguard, not as a goal in itself.
Why a ROAS of 0.5 can be the right call
Take the opposite case: a customer acquired through Meta Ads who places an average of four orders of PLN 200 each within six months, generating PLN 800 in revenue in total. That is how much you can pay for them.
The ad platform, however, sees only the first order: PLN 200 in revenue against an acquisition cost of PLN 400, which means a ROAS of 0.5 – in most accounts, a failure worth switching off in week two.
When you analyze performance over the six months after the first order, though, the revenue from a customer acquired this way exceeds their cost. The decision flips and now points to scaling the campaign as much as possible, as an effective one.
The whole difference comes down to what you take as the unit of measurement: a single order shows a PLN 200 loss, while the customer over six months shows a return with room to spare.
What to use instead of ROAS?
To grow efficiently, retention-driven D2C businesses should focus on optimizing for LTV/CAC. It is the only metric that captures the real value of an acquired customer and supports scaling.
LTV/CAC should reach the target value exactly at the end of the chosen period: 1.0-1.15 for paid campaigns, around 2-2.5 for the business as a whole. A result below 1.0 for the whole business undermines the model and a result above 4 shows you are spending too little on marketing. The threshold for paid campaigns is lower because free traffic adds to the result of the whole business: brand, direct and referral visits.
1. LTV on Margin I. Margin I is revenue minus cost of goods and discounts. Calculate it for customers acquired in a single month and sum it over a three- and six-month window, depending on the return on investment you want to assume. The basis must be your own, deduplicated data – ad platforms count the same orders several times, so the sum of conversions from the platforms exceeds actual sales. Anyone who settles budgets on their own data is ahead of 95% of the market.
2. Payback period. The payback period, meaning the time within which the investment in a customer should pay off, is set by the management board based on two things: how much cash the company has and how fast it wants to grow. The variants below are illustrative.
| Variant | Period | When to choose it |
| Conservative | 3 months | choose when cash is limited |
| Moderate | 6 months | start with this variant, the most common choice |
| Aggressive | 12 months | only with cash reserves or financing |
| 2-3x growth | 12-17 months | choose when scaling is the priority |
| Rare | 15-18 months | individual cases, calculate the risk before deciding |
3. CAC. CAC, the cost of acquiring a new customer, is calculated one way: you divide total marketing spend by the number of customers acquired and add order handling costs.
Repeat Order Rate (ROR) as an optimization metric
A technical and easily available indicator of an acquisition campaign’s quality is Repeat Order Rate (ROR). ROR shows what share of the orders attributed to a given marketing channel come from returning customers. It therefore defines the nature of the campaign and, as a result, its chances of a good LTV/CAC ratio. The higher the ROR, the higher the CAC usually is (a larger marketing cost is divided by a smaller number of newly acquired customers). Based on our clients, we define the following benchmarks for campaigns:
| Campaign type | Repeat order rate | What to do |
| Acquisition campaign, target level | below 30% | leave it as it is, this is the target level |
| “Acquisition” campaign above the threshold | 45-50% | split it, you are paying for media to reach your own base |
| Campaign to existing customers | 60-80% | measure it by ROAS |
When ROR is high, a good approach is to split the campaign into two parts: acquisition and, if you want to run one, a returning-customer campaign. The acquisition campaign should have lower ROAS targets in the ad platforms (the platforms optimize using ROAS) because in the short term we may be inefficient – scale is what counts. The returning-customer campaign should have a high ROAS – here we are fighting for monetization, not scale.
This is how you build an advantage a competitor can’t copy: whoever looks at ROAS takes a short-term view and won’t capture the real value of the customer being acquired. Because their effects are deferred in time, actions based on LTV/CAC work like a good investment – they may not seem logical for a while, but if everything is calculated properly, in the long run they deliver growth and profit. Irrational moves become very rational.
All the numbers in this article come from specific businesses we analyze at Sublime. If you want to see what a new customer really costs you and how long it takes to pay back, book a demo.