While building Sublime we have worked with a dozen Direct-To-Consumer (DTC) companies at different stages and sizes. Our job was to provide them with data and insights that would help them better understand the drivers of their business and growth. We have done it both in the form of an analytics platform and by providing data-related services ranging from web tracking, tools configuration to preparing models, reports and dashboards.
This article aims to summarize our main findings over the course of last 3 years in four areas:
- what are the key metrics that every DTC business should understand deeply and track regularly,
- how to structure your analytics to be able to quickly find valuable and actionable customer insights when needed,
- what are the probable challenges that you will face at each stage of your company maturity and how analytics can guide you through them,
- how to structure your company and technology stack so that analytics is really embedded in the daily decision making of your team.
The general purpose of this article is to give a CEO/CGO/CMO of a DTC startup a good starting point for thinking about their analytics setup over the long term.
What makes the Direct to Consumer business model work?
Before going into the details let’s take a quick look at what makes the DTC model unique and why that creates both a challenge and opportunity from an analytics standpoint.
The underlying premise of the DTC model is to build deep and long-lasting direct relationships with customers at scale. If the DTC companies are to succeed over traditional retail competition this should be their main area to focus and seek advantage.
Fortunately for them, DTC companies own all customer touchpoints and the data that is flowing through. This represents a great opportunity to use data which traditional retailers don’t have in all areas of the business: drive product development, design communication, optimize distribution or after-service. What is more, having that continuous flow of valuable data and insights, DTCs can operate much faster than traditional competition, making instant changes, tests and improvements.
On the flip side, managing all customer data that is fragmented and flowing from many different sources represents a major challenge. Each tool used within a company (shop platform, ad platforms, web analytics, marketing automation etc.) collects only partial information. DTCs are mostly left alone with the task of stitching it together and building a full picture of the customer to be able to use it for insights and optimization.
Managing all customer data that is fragmented and flowing from many different sources represents a major challenge.
What we have seen is that this challenge can be especially painful at earlier stages of the business. You are running on tight budgets and deadlines, navigating product development iterations to find product-market fit and at the same time facing fierce competition from traditional brands that have bigger budgets, wider distribution and efficiencies of scale.
Add to that the fact that DTC business is capital intensive (initial investment in customer acquisition is usually covered after 2nd or 3rd customer order) which means you are also facing pressures related to cash flow and external financing. As a result DTCs have to regularly prove their economics to investors.
Our job here is to make things a bit easier. Let’s start with breaking down and explaining the DTC business model.
The economics behind DTC business model
Economics of DTC is a complex issue as there are many moving parts both on the revenue and cost side. But in our experience, for practical reasons, we can reduce it to the factors presented on the chart.
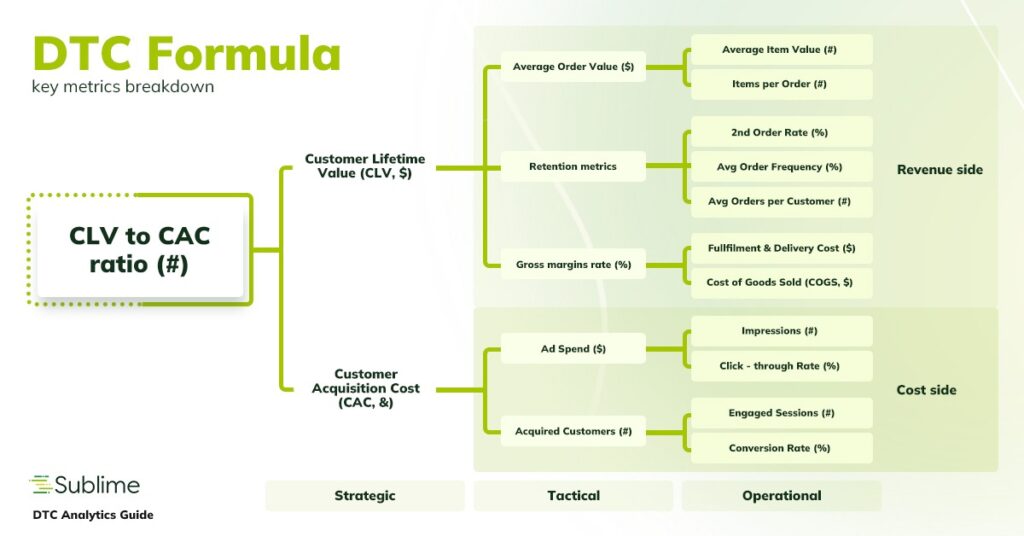
Let’s take a tour on all key metrics from the chart to understand what they mean and how to track them. Let’s start with understanding the overall relationship between Customer Lifetime Value and Customer Acquisition Cost.
Measuring Customer Lifetime Value vs Customer Acquisition Cost
Being a startup DTC usually means a huge focus on growth and customer acquisition but at core every e-commerce company aims to be a profit driver at some point. Why acquire customers if we lose money on each one of them?
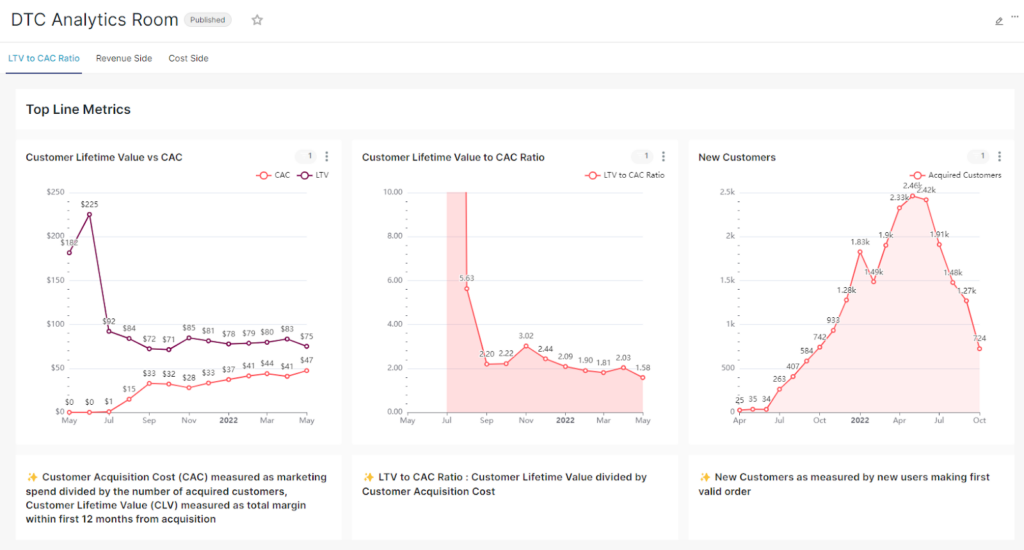
Closely observing the ratio between expected Customer Lifetime Value (i.e. how much profit each customer brings within a given period) and Customer Acquisition Cost (how much did it cost to actually get that customer to try our products) is an absolute necessity in order to manage the unit economics.
But as we found out, tracking LTV to CAC ratio properly and regularly is not yet an industry standard. Even more rare is for companies to try and operationalize LTV to CAC, i.e. bring it down to simpler, more controllable metrics in order to influence the ratio. Finally the holy grail of finding pockets of customers with higher than average LTV to CAC and optimizing on them is achieved by only a few today and usually late at the maturity stage of the business.
Tracking LTV to CAC ratio properly and regularly is not yet an industry standard.
Let’s look now at each of those strategic metrics individually.
How to calculate Customer Lifetime Value (LTV)?
The idea behind Customer Lifetime Value is simple – calculate how much money each customer is bringing to the company. The difficulties arise when we are trying to come up with actual calculations. Let’s break this down into each word from the definition:
- Customer – this may seem clear but actually can become tricky as there are a number of ways we can define a customer. Usually a unique customer identifier that is assigned by the shop platform is used. However this breaks down when migrating to a new platform or database for instance. Sometimes our customer can register under multiple accounts and therefore will have multiple customer identifiers. In Sublime we try to combine multiple techniques to identify a unique customer but using a customer email is usually the best place to start.
- Lifetime – defining this component of the LTV metric is probably most tricky and there is no one answer. Usually it comes down either to the specific way that customers consume products (i.e. over the course of 1 year with monthly cadence etc.) or the investment plan (i.e. there is a 2 year window over which the company is required to deliver certain profitability). A good way to start is with 3-, 6- and 12-months LTV, which will be long enough to cover any seasonality and payback periods but short enough to have more data points.
- Value – when we think value cumulative revenue comes to mind but to get a more accurate reflection we should use a contribution margin which is usually calculated as net revenue minus all costs closely associated with orders (costs of products, fulfillment, delivery, transaction etc.).
Managing the Customer Lifetime Value is crucial to profitability. To be profitable LTV will have to cover the Customer Acquisition Cost which is less controllable by the company and will grow as the company scales up. A good rule of thumb at early stages is for the LTV to be at least two times higher than CAC.
A good rule of thumb at early stages is for the LTV to be at least two times higher than CAC.
Usually Customer Lifetime Value is calculated on a monthly/weekly cohort basis, i.e. how much value (within the first 12 months from acquisition) was generated by an average customer acquired in March 2021 etc.
Finding Customer Acquisition Cost (CAC)
Calculating Customer Acquisition Cost can also pose challenges, especially if we want to observe it not only over time but also in different segments. In general there are three cost components to be included in the metric:
- Media Spend – this covers all expenses on running ads across all paid channels and may also include influencer fees.
- Production Spend – all expenditures related to the production of promotion materials including ads, videos, email templates or landing pages which will be used in acquisition efforts.
- Agency/Marketing Team salary – this is optional but if we can clearly attribute salaries to the customer acquisition efforts it is worth to take it into consideration.
That cost is aggregated over time and then divided by the number of acquired customers.
Usually Customer Acquisition Cost is calculated on a monthly/weekly cohort basis, i.e. how much have we spent on an average customer acquired in March 2021 etc.
Managing cash flows with Payback Period metric
An important addition to the LTV:CAC calculation is the Payback Period, which shows after how much time from customer acquisition (months, quarters) LTV has caught up with CAC.
There is an important assumption behind, which is that the only costs associated with acquisition are incurred at the moment of acquisition. After that moment the customer will continue placing more orders so the LTV will be going up but CAC will remain steady. This assumption rarely breaks but some exceptions might be needed, for instance if we run costly remarketing campaigns to our existing customers.
Payback period is an essential metric to track on a monthly cohort basis in order to manage cash flows and financing cycles.
Let’s now move to tactical and operational metrics that affect both LTV and CAC and we will start with the revenue side of the business.
What are the key metrics driving DTC Sales?
LTV is a complex strategic-level measure on the revenue side of business and in order to operationalize it let’s explore its components:
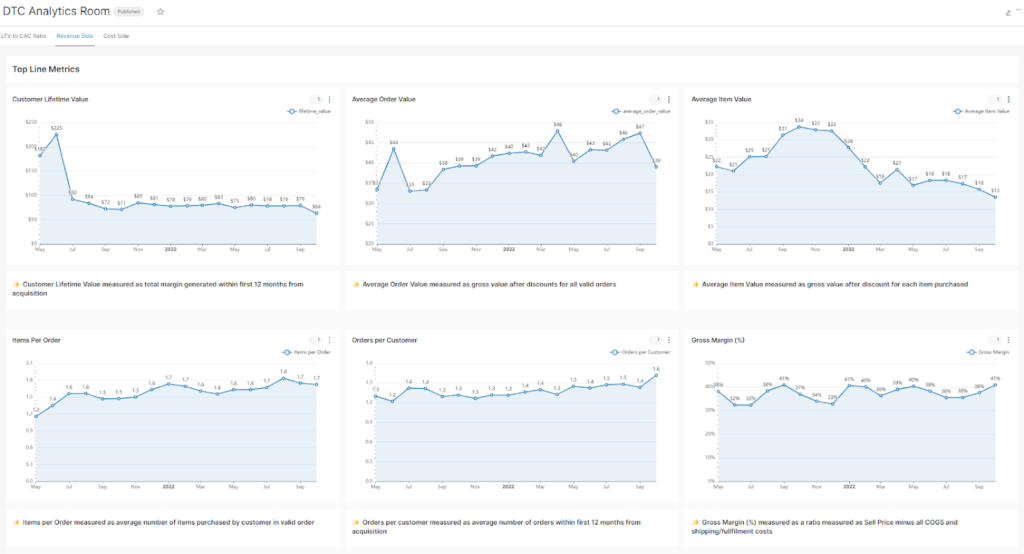
Average Order Value (AOV)
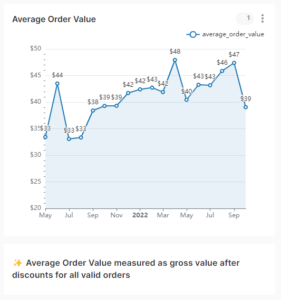
Average Order Value (AOV) should reflect how much money the customer spends at a single purchase. Therefore, we recommend tracking Average Gross Order Value after all discounts. Naturally, only valid and paid orders should be used for calculation (watch out for outliers such as big, one-time B2B orders).
Usually AOV (together with Retention Rate) is the most important determinant of LTV and it’s definitely worth spending time to optimize this metric. However, when trying to raise the AOV it’s also important to monitor retention rates and order frequency. In the end it’s the Lifetime Value that interests us the most so we should avoid raising AOV at the expense of fewer orders per customer.
Average Item Value
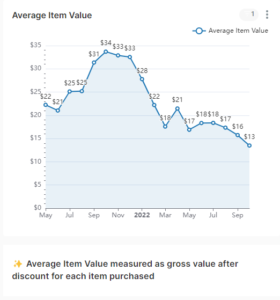
Average Item Value (AIV) is a component of the AOV, closely related to pricing and discount policy. When moving prices up or down or manipulating with discounts Items per Order or Order Frequency metrics should also be observed. Lower prices might temporarily decrease revenue but may have a positive long-term impact or the other way around.
Items per Order
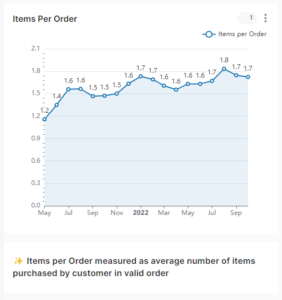
Items per Order is a second component of the AOV. Usually this is a reflection of how well the product portfolio is designed. When adding new products to the range this metric should be carefully observed to detect product cannibalization (when newly added product does not result in Items per Order metric spike but actually pushes out other products from customer carts).
Retention Rates
There are multiple ways we can look at retention or customer churn. Usually that would be correlated with our payback period. If the payback period is achieved at 2nd order it would be a good idea to track the percentage of customers reaching that threshold (i.e. 2nd Order Retention Rate).
If our additional goal is to achieve payback before month 6 then a good metric would calculate 2nd Order within 6 Months Retention Rate (%).
Retention rates are usually calculated on a cohort basis (monthly/weekly) or in subsegments of customers.
Average Order Frequency
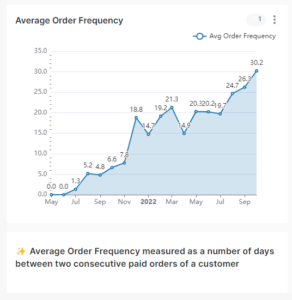
A metric related to retention and payback period is Average Order Frequency, calculated as an average time period between two consecutive orders. Usually it is also correlated with AOV. The more customers buy at a single order the longer it will “last” (i.e. another order will be done at a later date). This is not to say that this metric cannot be influenced and improved, for instance through order remainder campaigns or discounts.
Average Number of Orders per Customer
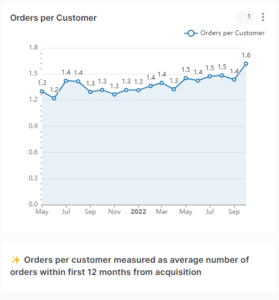
Another way to look at retention/repurchases is to calculate Average Number of Orders per Customer. As it is with most metrics, it is also a good idea to look at the distribution of values here. Basic statistical measures like median or range are very helpful here. For example, if our goal is to have an average of 2-3 orders per customer it might just as well be achieved through an extra loyal subsegment. Such a subsegment can generate 8 or 10 orders and makes up for a large share of one-time customers. As a result, the average metric will be calculated with significant bias. A subscription model may lead to such a scenario when a relatively small base of subscribers (say 20% of active customer base) is the driver of the overall retention. In such a situation, apart from looking at the distribution, it is a good practice to analyze each customer segment separately.
Gross Margin Rate
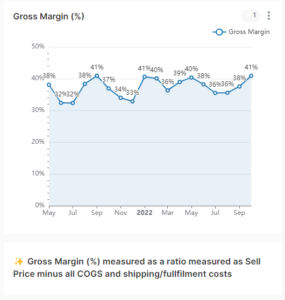
Gross Margin Rate is usually calculated as Net Revenue (excluding taxes) minus Costs of Goods Sold and other direct costs (Fulfillment / Deliveries / Payment provisions etc.) divided by Net Revenue. This should cover most of the costs associated with fulfilling an order and be a good representation of the profit generated on each purchase.
What are the main components of Customer Acquisition Cost in the DTC business model?
Just as LTV, CAC is a complex strategic-level measure but this time on the cost side so in order to operationalize it let’s explore its components.
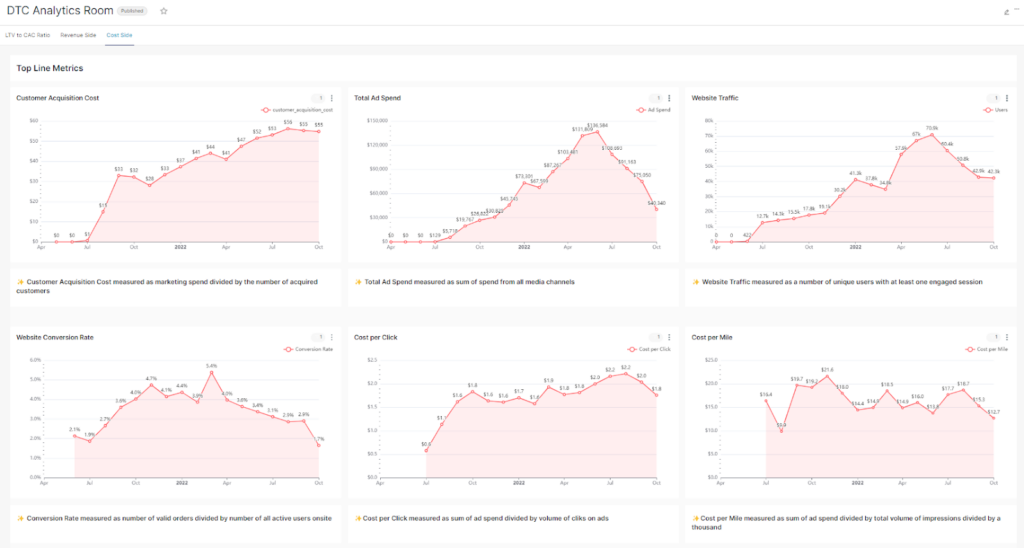
Ad Spend (and other acquisition-related spend)
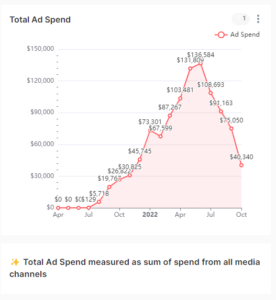
Ad Spend combines expenditures from all paid media channels and optionally other spend, including Production Spend, Influencer Fees, Agency Fees or Marketing Team Salaries.
One crucial part related to ad spend is a proper tagging strategy and implementation which is a key to get granular understanding of different media performance and marketing ROI optimization.
Good tagging strategy should allow to track performance across channels, campaigns, creatives even to the level of single ads. On a side note the task of building and maintaining a rich tagging and naming convention for analysis is in itself a great challenge where many DTCs fail.
Good tagging strategy should allow to track performance across channels, campaigns, creatives even to the level of single ads.
Cost per Impression/View
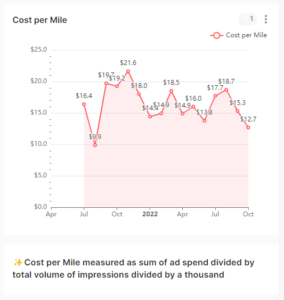
When our ad performance is falling a reason behind this might not be related to ad or creative performance but to the simple fact that the advertising space is getting more expensive. This is particularly true for high season when there is an extra demand from advertisers (such as Black Friday). Cost per Impression is a good indicator of that.
Cost per Click
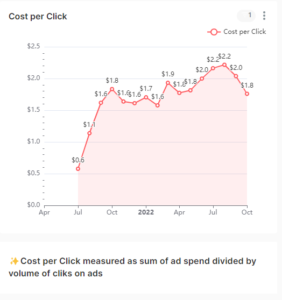
Cost per Click is a reflection of media spend and ad/creative performance (measured with a related Click-Through Rate). Our recommendation here is to measure clicks that lead to an engaged sessions on the website so that we focus on high quality clicks. Fluctuations in cost per click metric usually mean one or both of two factors: either our ads are losing edge over time and Click-Through-Rates are falling or simply the ads are getting more expensive (see Cost per Impression/View metric).
Website Traffic
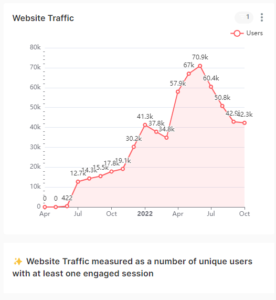
The ability to consistently bring high quality traffic to the website is essential for DTCs. Therefore it is important to select the right metric to reflect that. With the recent emergence of GA4 as a Universal Analytics successor there might be some confusion coming from different methodologies of both tools. For either one of them our recommendation would be to measure the traffic as a number of unique users with at least one engaged session. That way we can already have a first quality check on the quality of incoming traffic.
Equally important to the overall traffic is the breakdown into paid and unpaid traffic as the characteristics of each of them are drastically different. While building a strong share and volume of unpaid traffic is a critical and strategic long-term goal, in order to make a quick impact DTCs have to rely on paid traffic.
While building a strong share and volume of unpaid traffic is a critical and strategic long-term goal, in order to make a quick impact DTCs have to rely on paid traffic.
Conversion Rate
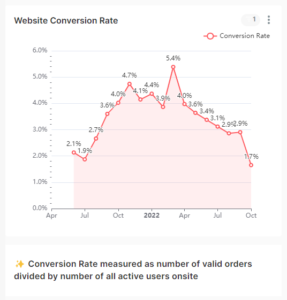
Conversion rate should capture the quality and commercial intent of the incoming traffic. Usually it is measured on a per user basis, i.e. number of desired conversions divided by total number of users engaged onsite. Order conversion rate is the topline metric here but for optimization purposes companies need to break it down into each individual step in the purchase funnel.
As with paid/non-paid traffic, the same distinction should also be carried out in relation to ecommerce conversion rates.
Building analytics capabilities to support DTC Strategy
Top DTC companies use analytics to solve specific problems that arise
As mentioned before, one key challenge that DTCs face has to do with customer data fragmentation in an constantly evolving environment. Trying to control all the abovementioned metrics and optimizing all areas at once is an impossible task to carry. Not to mention the huge effort to manage all the tools, data pipelines, reports and dashboards.
Our recommended approach is to always focus on specific use cases that are or will be crucial over the course of the coming months. Once you select those you can design and implement an analytics structure that would cover those use cases, including: data sources, data pipelines, metric definitions, dashboards and reports. As the business grows and your needs evolve you will add more blocks to your analytics house.
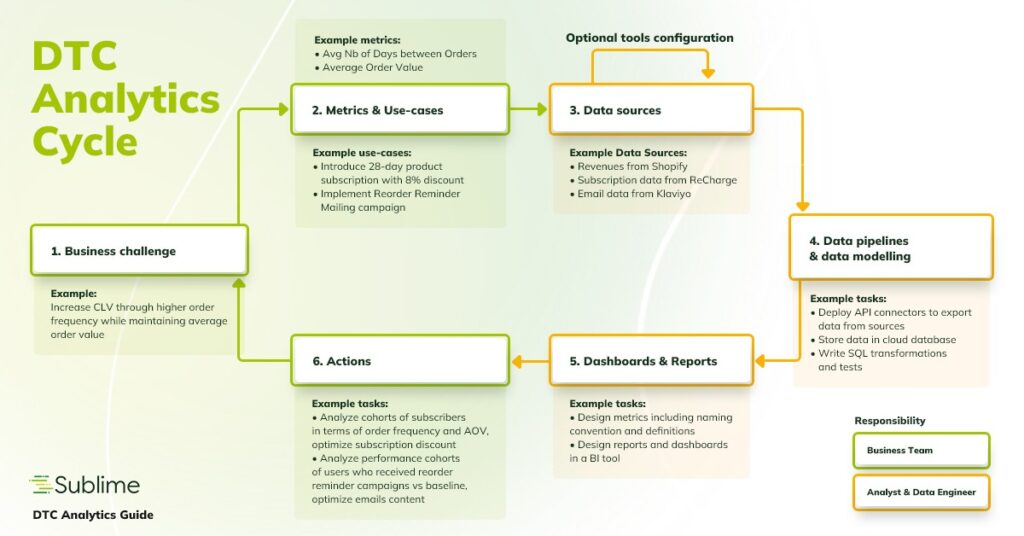
What are the most impactful analytics use cases for different stages of DTC company maturity?
Below we present a selection of business use cases for analytics that in our experience are worth exploring to tackle specific problems that arise at each stage of the company’s maturity. For that task we have distinguished 4 stages of a DTC brand development:
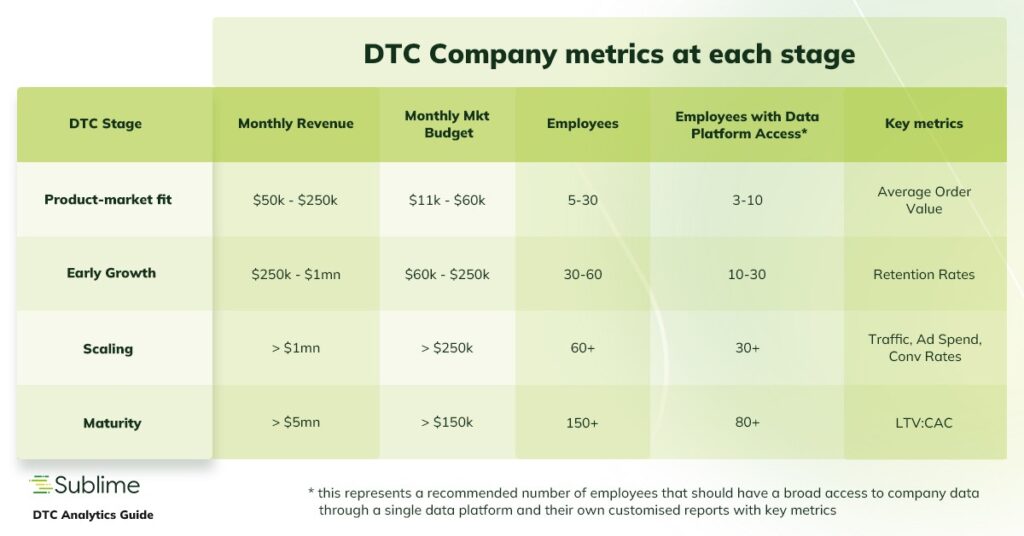
* this represents a recommended number of employees that should have a broad access to company data through a single data platform and their own customised reports with key metrics
Analytics use cases for product-market fit stage
Usually DTC brands at the product-market fit stage focus on getting the products and product portfolio right while leaving the overall LTV:CAC considerations for later stages. For that reason the metrics to focus on are related to single purchases such as Average Order Value, Average Item Value or Items per Order.
DTC brands at the product-market fit stage focus on getting the products and product portfolio right while leaving the overall LTV:CAC considerations for later stages.
Business use cases for analytics at product-market fit stage:
- Manage Product Portfolio by analyzing:
- 1st order Conversion Rate by Product/Item – calculated as a number of purchases of particular item divided by the number of product views on the website, this shows whether a particular product seems attractive to prospective customers.
- Avg Review Score by Product/Item and Product Return Rate by Product/Item – this will help identify badly designed products or verify the consistency of product quality.
- Product Reorder Rate by Product/Item – calculated as the percentage of times when a certain product has been ordered in two or more consecutive orders, which shows the stickiness of the product.
- Word Map by Product/Item – this is a graphical representation of words most commonly used when searching for or reviewing a product which offers a great inspiration for how to advertise and describe the product both on the ads and website.
- Revenue per Click by Product/Item – calculated as the revenue from a product attributed to paid traffic, divided by the number of ad clicks directed to a product as a landing page. This helps to adjust acceptable Cost per Click in paid campaigns for product promotion.
- Most Frequent Basket Contents – shows in percentages which products are usually purchased together, which indicates how to develop product portfolio to increase the Items per Order metric.
- Optimize Discount Rates by analyzing:
- Average Order Value vs Average Discount Rate – increasing the discounts rates will naturally bring down the average price per item and negatively impact average order value. The key to that move however is whether the lower revenue at each order can be compensated by other factors such as conversion rate or retention rate.
- User Conversion Rate vs Average Discount Rate – something to look for when deciding on discount rates is the First Order Conversion Rate, if we get more users to make first order this might help compensate the lower AOV.
- 2nd Order Retention Rate vs Average Discount Rate – alternatively, giving a second order discount might have a positive effect on retention and can help get the customer hooked for a longer period of time.
- Product Bundles or Build-Your-Own-Pack (BYOP) – many DTC’s sell their products either or both through Build-Your-Own-Pack option or product bundles/sets, usually with a quantity discount. When deciding on which options to run or promote it is useful to tests both and keep track of affected metrics such as:
- Average Items per Order by Bundle/BYOP – who selects more products, those who go for the set or those who choose to carefully build their own pack?
- Average Price per Item by Bundle/BYOP – keeping in mind all discounts which option results in a higher average price per single item?
- Average Order Frequency by Bundle/BYOP – does a larger first order from a set result in a higher Lifetime Value or maybe a customer will choose to make next orders less frequently?
Analytics use cases for early growth stage
Once the DTC optimizes their product offering, which means the Average Order Value is at a satisfying level, the next goal on the horizon is to get the customer to make repeat purchases. Naturally, a big determinant of customer retention is whether customers actually like the products or not. But there are many other factors that come into play and companies usually focus on them at the early growth stage. So this time the key metrics will be related to Customer Retention rates such as: 2nd Order Retention Rate, 3rd Order Retention Rate or Average Number of Orders per Customer.
The next goal on the horizon is to get the customer to make repeat purchases.
Business use cases for analytics at early growth stage:
- Run product subscription by analyzing:
- 2nd/3rd Order Retention Rate by subscriber/non-subscriber- this is a core metric to look for with product subscriptions and due to higher retention rates product subscribers can be 4-6 times more valuable than non-subscribed customers. That difference in value usually comes from a relatively small pocket of very loyal subscribers reaching very high number of orders.
- Average Order Value by subscriber/non-subscriber – usually subscription AOVs are lower than for one-time orders, which comes from subscription discounts, but the drop in AOV should easily be compensate by retention rates.
- Avg Order Number at Subscription – this metric should indicate when is the best moment to offer a product subscription to a customer. In some cases customer might want to try a product first through a one-time order and in others they have no barriers to subscribe at first order.
- Share of Subscriptions at First Order – this metric is useful when trying to set a subscription as default payment method and optimize the website and discounts for that goal.
- Fix fulfillment/delivery issues – at the early growth stage fulfillment or delivery issues are to be expected. The key here is to track them, keep the customer aware if anything happens and understand how much of an impact it has on customer retention:
- Average Total Delivery Time – this measures the total waiting time from the customer perspective, from the moment of payment to the final delivery, excluding all holidays and business days.
- Average Fulfillment Time – this metric looks at the fulfillment times from the moment of payment until the start of delivery .
- Average Delivery Time – this metric looks at the delivery times from the moment of package fulfillment.
- 2nd/3rd Order Retention Rate by Delivery Time Intervals – retention measure captures whether the delivery issues affected customers to the point that affects any future orders.
- Total Delivery Time Outliers – this looks for instances when delivery time is exceeding the average by at least a standard deviation and lets the operations and customer service teams address the issue on time.
Analytics use cases for scaling stage
Optimizing for AOV and Retention Rates in previous stages means that the Customer Lifetime Value is now at a good enough level. The next stage is about managing the CAC while scaling up acquisition channels. Metrics to focus on include: Engaged Traffic Volume, Conversion Rates, Share of Unpaid Traffic, Click-Through-Rates, Ad Click Cost, Ad Impression Cost etc.
The next stage is about managing the CAC while scaling up acquisition channels.
Business use cases for analytics at scaling stage:
- Optimize media mix with attribution modeling – when trying to calculate media channel performance a common mistake is to rely solely on the numbers generated in the reporting panels of various ad platforms. Among many issues most serious include double-counting of conversions between different ad channels or different attribution models used by each tool. To get reliable metrics we recommend our customers to run custom attribution models that are based on actual revenues from the ecommerce platform, user conversion paths coming from a web/app tracking application (such as Google Analytics) and a proper UTM tagging structure that links user activity on-site with ads clicked and ad spend.
- Ecommerce funnel optimization with A/B tests – the order of operation here is quite simple:
- start with tagging most crucial steps on the ecommerce shopping funnel (this should include: product view, add to cart, checkout start, shipping details, payment details and purchase confirmation),
- calculate completion rates for each step individually and globally (i.e. checkout start to add to cart and checkout start to all users). When visualizing this data a good tip is to exclude users, who enter the path at later stages because this will distort the step completion rate,
- design and run a/b tests on specific elements of the funnel and observe what happens on this specific step and how it affects the global completion rates,
- after the a/b test, it takes some time to understand completion rates in subsegments such as: new vs returning users, organic vs paid traffic sources, different devices and environments.
Analytics use cases for maturity stage
Being at the maturity stage does not mean companies are not aggressively looking for more growth. However, having all the major areas more or less optimized the focus shifts towards customer segmentation and finding and optimizing for pockets of customers who bring higher than average profitability (meaning LTV to CAC ratio). Below is a sample of our most popular segmentations, worth exploring to understand differences in performance between customer segments.
Business use cases for analytics at maturity stage:
- Segment by Product Usage Patterns – this segmentation is based purely on transactional data and tries to identify segments of customers based on their product consumption behaviour (this may include the variety of products consumed, if those products belong to a particular group or category, the intensity of consumption etc.).
- Segment by Geolocation – a segmentation based on the geolocation data based on order deliveries, which may show some insights about city sizes, east vs west, north vs south etc. When looking at performance at the state or city level it is recommended to take into account the population density of each area as a weighting mechanism.
- Segment by Demographics – a segmentation based on age groups and gender of customers, helps determine which groups are more profitable for the business.
- Segment by Acquisition Channels – this segmentation is based on the acquisition channel (or going deeper on the campaign, adset or particular ad) according to attribution modeling strategy and it helps to judge not only which channels bring the highest volumes of customers but also the long term value to the business. In the end we want to optimize LTV to CAC ratio for each channel, which means a higher CAC might be justified for a particular channel as long as it will be covered by future revenues from those customers.
- Segment by Web vs App – this segmentation is based on the primary sales channel that the user is active on, whether it is mobile web, desktop web or mobile app. While getting a user to download and start using an app might be more challenging and expensive this may be worth it in terms of higher loyalty of those users.
Setting up DTC company to be led by customer data
Setting up a company so that most of the decisions are backed by data and customer feedback is not an easy task, especially when the budgets are tight and priorities revolve around constant growth. Challenges relate to both technology (choosing and configuring the right tools) and team culture (making sure data is used across the entire organization on a daily basis).
Analytics tools for DTC
When it comes to the technology stack the first question that might arise is whether a DTC startup actually needs to set up their own analytics. After all, most of the tools already offer some kind of analytics panel with simple dashboards and reports. That approach might work in very early days but serious issues will appear soon such as:
- Lack of a single customer view – because of a large number of tools, each collecting only partial information about customers and using each own user identification method, understanding a full picture of a customer becomes practically impossible. As a result, instead of optimizing the LTV to CAC ratio and improving the overall customer experience, the company focuses on less critical, more “local” metrics such as number of orders or website conversions.
- Inconsistent metric definitions – having multiple panels reporting on the same metrics (such as revenue) it is inevitable that there will be differences in calculation methods. And small differences can lead to large discrepancies between those panels and reports. This creates a distrust in data and leads to a constant, time-consuming data reconciliation process and an analysts nightmare.
- Manual reporting – relying on tools panels for overall reporting also leads to exporting multiple CSV files and stitching them together manually in spreadsheets. This is a time-consuming and error-prone process that hinders the company’s ability to act on recent data. Not to mention that you are operating on heavily aggregated data that leaves very little room for more advanced analytics.
- Lack of data continuity if tools change – when a DTC company scales it is to be expected that it will deploy new tools and replace existing ones. As a result, without an analytics stack, the customer data generated in these tools will either be lost or will not be very useful.
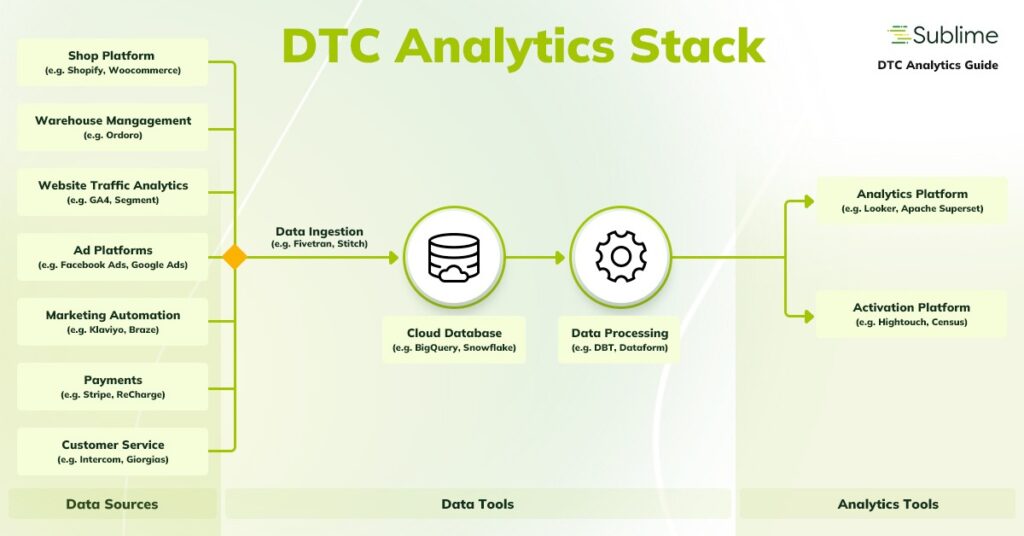
All above in the end leads to overall distrust in data and discourages employees from using data in their decision making. So for DTC companies that think in the long term our recommended option is to go for your own analytics stack as early as possible. Which means the following data & analytics tool will have to be deployed:
- Data ingestion – data ingestion tools (such as Fivetran or Stitch) are there to help you export raw data from most popular e-commerce tools into a data warehouse of your choice. You basically select a data source from a range of available connectors, point to a database destination and within minutes the data starts flowing into your warehouse. These tools usually charge based on a volume of ingested data so getting started early is not a heavy financial burden.
- Cloud Data Warehouse – analytical and data warehouses such as Google BigQuery or Snowflake are the backbone of modern analytics stack providing the ability to store large amounts of data and run complex queries in a cost-effective way,
- Data processing – raw datasets, sitting in a cloud database, need to be tested, cleaned and modeled before being sent for analysis or activation. Tools such as DBT or Dataform help streamline that process and manage data pipelines when data sources or business needs evolve.
- Analytics Platform – cleaned, tested and modeled data can be sent to an analytics platform where analysts and business users can make data explorations, create charts, reports and dashboards. Usually it is also the place where all metric definitions and naming conventions are stored. This category of tools is very broad and includes free tools such as Data Studio, more traditional BI and Visualization platforms (Microsoft PowerBI, Tableau) that are mostly from a pre-cloud times and fully-fledged, cloud-ready Analytics platforms (Looker, Apache Superset).
- Activation Platform – this is the most recent category of tools (Hightouch, Census etc.), also called Reverse ETL, that work in a reverse way to ingestion tools. Their goal is to help you send back a processed data from you warehouse to a selected “destination” tool (for instance you could send actual revenue data from your warehouse back to Facebook Ads Platform for a more accurate attribution).
What is a metric-driven organization and why a DTC company needs to be one?
A key aspect of having a data-driven approach is the team culture and working practices. It’s not the number of dashboards that determines success here but whether a large number of people within an organization use it regularly to state hypotheses and look for answers. Something that you, as a CEO of a company can also put on a dashboard and measure.
Here’s a couple of tips, that from our experience, might help you promote a data-driven culture in your organization:
- Run your own analytics, do not rely on reporting panels in your tools – if your team is to be aligned around data you will have to run your own analytics, that will ensure team members and departments work on the same datasets and consistent metric definitions.
- Keep your metric definitions clear and widely accessible – having a central repository of how metrics are defined and calculated will help your employees navigate the dashboards and reports without having to resort to analysts to answer simple questions. Ideally you would like to have all your employees to have access to base metrics and their definitions.
- Make your organization metric-centric and assign business owners for key metrics across teams – as you as the CEO delegate goals and responsibilities make sure that there are key metrics assigned to business owners within your team and that there is a clear owner for each of them. That will help promote the data-driven culture across the organization and break the ‘old-fashioned’ department siloes.
- Shift simple data exploration from analysts to business people – most of the data questions are really simple (“show me this metric at this time and break it down by this segment”). Modern analytical platforms allow for that level of self-service analytics which means that business people with basic, excel-level analytics skills can answer such questions without the help of a trained analyst.
- Invest in basic SQL capabilities within teams – learning basic SQL is not as difficult as it may seem so it doesn’t have to be limited to analytics department or technical people. Investing in basic SQL capabilities across every department can bring significant benefits: your employees are able to get many answers from data themselves much faster plus you save a lot of time of highly skilled analysts, who can tackle more complex issues.
- Minimise assignments for your core IT department, go for software solutions – your core IT department, whether in-house or outsourced, will always have a strong focus to develop and maintain core (user-facing) applications therefore analytics will be a second priority. From that perspective going for SaaS solutions and outsourcing of skills such as Data Engineering is usually the better option.
Key Takeaways
Key points from the article:
- Customer analytics is essential for DTC success yet hard to perform especially at earlier stages,
- DTC economics is a complex topic however you can structure your thinking around the LTV : CAC metrics and their core components,
- Running your own analytics is the only way to have your team aligned around data and ensure there is a data-driven approach to daily decisions.
Before investing in analytical capabilities ask yourself:
- What are my goals/challenges for the coming months? What metrics will I need to track to see progress? Can I break down those metrics into segments for optimization?
- Is my current analytics setup enough for that? Are my metrics trustworthy and delivered in time? Is my team operating on the same set of metrics?
- Where is the data stored, in which tools? Are they configured? Can I connect them on a customer/user level and build analytics on top of that? Do I have internal capabilities to perform that task?
Want to turn analytics into a true growth driver for your DTC brand? Schedule a free demo of Sublime and see how we help you track LTV:CAC, retention and acquisition costs with confidence.