Why We Built Growth Compass
At Sublime, we love e-commerce metrics – so much that our platform includes over two hundred of them! Each metric tells part of your brand’s story, but navigating this sea of data can be overwhelming. Many DTC founders and executives find it challenging to quickly understand the overall health and trajectory of their business.
When one customer asked if a single metric could clearly summarize their business’s health, we took it as a challenge. We recognized the need for clarity in decision-making, especially when traditional metrics like ROAS, Cost Per Order, and Conversion Rate often conflict. That’s why we created Growth Compass – an intuitive tool designed to help founders, executives, and marketers quickly grasp their business’s big picture, enabling smarter and more strategic decisions.
The Growth Compass was born out of a question I asked the Sublime team – one that every DTC CEO and marketer eventually faces:
Are we ready to scale marketing and where should we do it?
This tool is built around predictive LTV:CAC modeling and presents the insights in a clear, strategic format – both at the overall business level and broken down by individual channels. –
Michał Abram, CEO & Co-Founder at Natu.Care

How Growth Compass Works
Just like a traditional compass clearly indicates your direction, Growth Compass provides a straightforward visual representation of your business’s trajectory. Specifically tailored for direct-to-consumer (DTC) and e-commerce brands, it answers a crucial question: “Are we headed toward profitability, or do we need to adjust our strategy?”
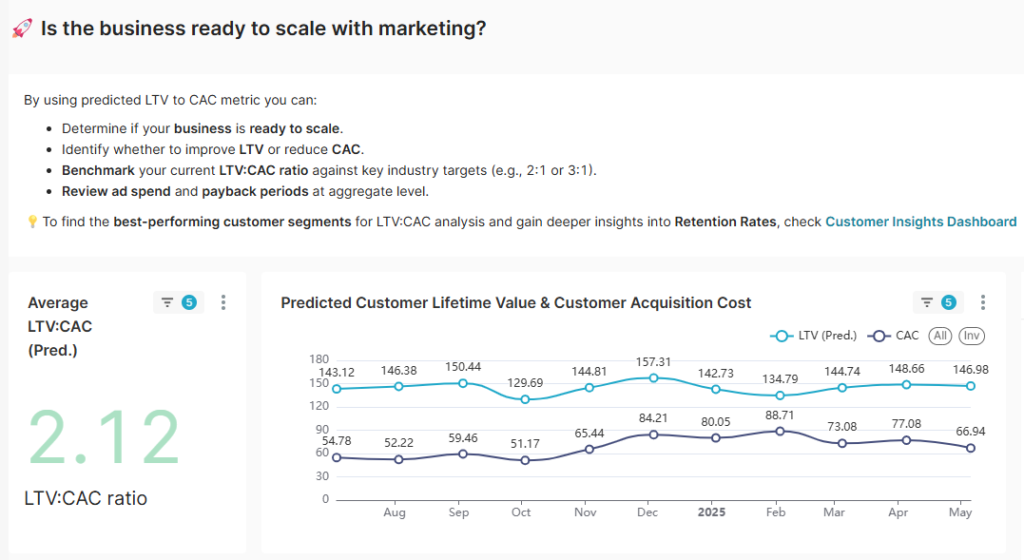
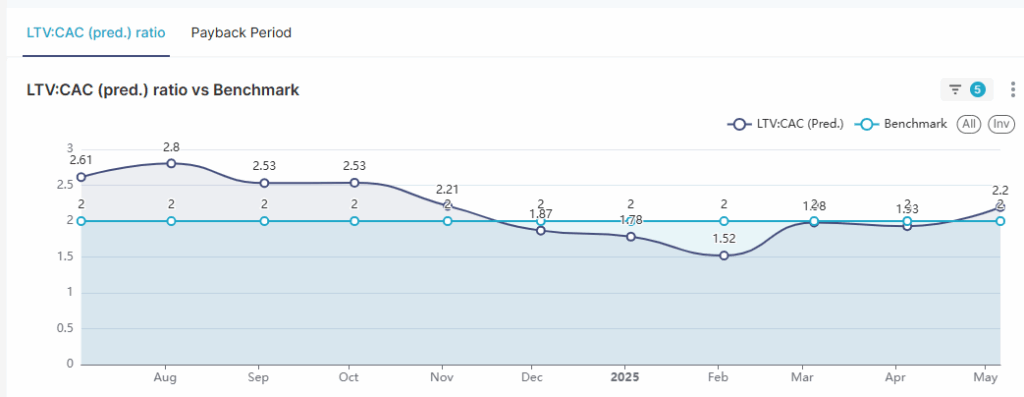
Growth Compass calculates your predicted Customer Lifetime Value (LTV) – customizable across various timeframes – and directly compares it with your Customer Acquisition Cost (CAC). This essential comparison yields your forecasted profitability ratio (LTV:CAC). With Growth Compass, you understand if your spending strategy supports your business goals.
Benchmarking Your Performance in the right Context
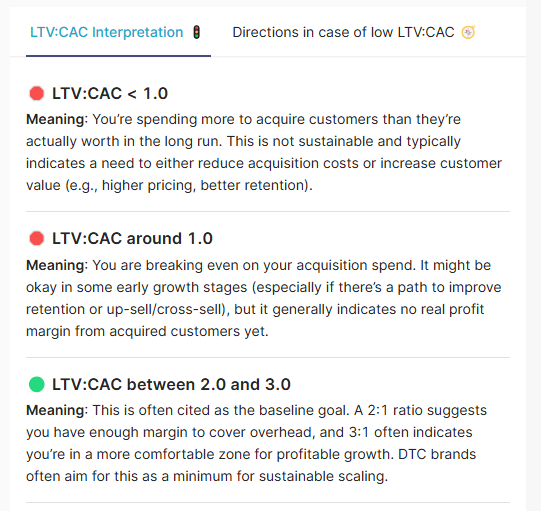
Growth Compass doesn’t simply provide forecasts – it contextualizes your performance against established industry benchmarks. Typically, a healthy LTV:CAC benchmark for e-commerce brands ranges between 3:1 and 5:1 (see this report by Recharge as an example: The Importance of DTC:CAC for DTC ecommerce brands). This comparison against the benchmarks helps you quickly identify how your brand measures up against similar businesses.
- Above Benchmarks: Indicates excellent profitability and strong business fundamentals. Being above the benchmark means your business is healthy, efficient, and ready for accelerated growth. You have clear signals that increasing your marketing investment will likely lead to greater revenue without significantly sacrificing profitability.
- At or Below Benchmarks: If your metrics hover near or fall below industry benchmarks, it’s an important signal to pause and refine your strategy. You may need to focus on lowering acquisition costs (CAC) through more targeted campaigns or enhancing your customer lifetime value (LTV) by improving retention strategies, increasing customer loyalty, or driving higher repeat purchases.
This provides a valuable foundation for identifying and targeting specific areas of your business that require optimization to improve overall profitability. Learn more about how analytics can support you in those areas in **DTC Analytics Guide: How modern analytics can fuel the growth of a consumer brand.**
With its intuitive structure, clear benchmarks, and the ability to adjust key assumptions (such as attribution model or predictions), the dashboard helps guide data-informed decisions through meaningful, actionable visualizations – without the need to build complex models internally.
– Michał Abram, CEO & Co-Founder at Natu.Care
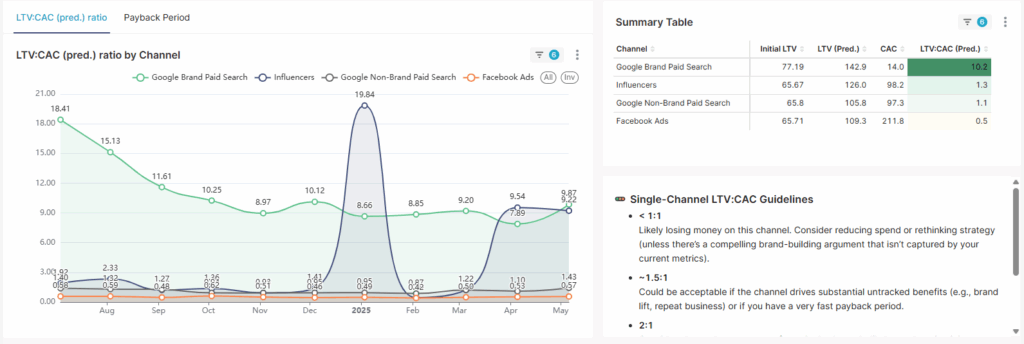
Channel-Level Insights: Identify Where to Scale
Growth Compass goes beyond general insights – it allows you to drill down into specific marketing channels. This detailed view helps you pinpoint exactly which channels deliver sustainable profitability and which need optimization. For instance, you may find that your Facebook Ads channel significantly outperforms Google Ads, guiding strategic decisions to allocate budget effectively.
Our Attribution Dashboard complements these insights by offering in-depth analytics, such as channel-specific conversion rates, average order values, and detailed customer journeys.
As a CEO, I value Growth Compass, because it gives me a fast, strategic overview of where our marketing spend is working – and where we should push harder. It bridges the gap between finance, growth and marketing, helping me make confident, ROI-focused decisions.
– Michał Abram, CEO & Co-Founder at Natu.Care
See Growth Compass in Action: Get Your Demo Today!
Getting started with Growth Compass is simple. If you have at least 18 months of historical sales data, you’re ready for accurate, reliable forecasting – no complicated setups required.
Take control of your brand’s future today. Schedule your free demo or start a trial now to see Growth Compass in action. Align your metrics with your strategic goals clearly and confidently scale your DTC brand sustainably.