You’re no longer limited to rigid presets or black-box dashboards. Whether you want to look at customers acquired during a specific campaign, those who bought a certain product, used a discount code, or belong to a specific channel or audience group – you can.
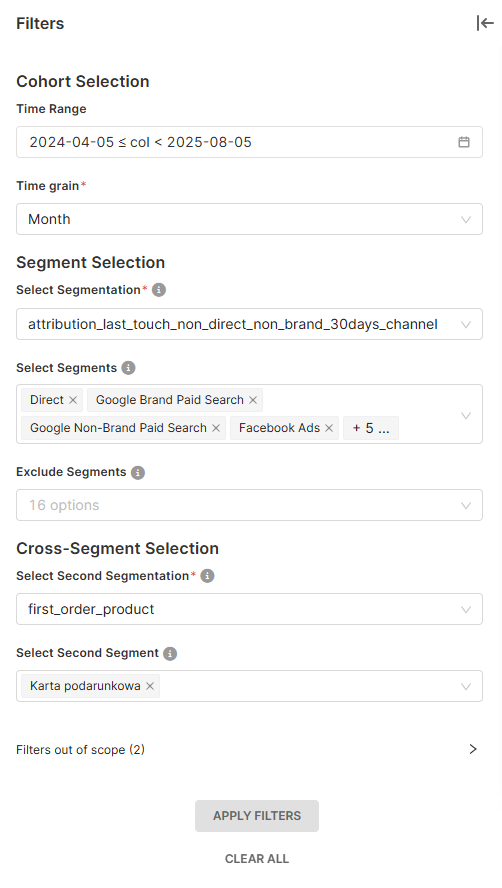
Sublime gives you full control over how you measure retention, allowing you to track when and how often customers return, across any cohort or segment you define.
Unlike most analytics tools, which only offer generic retention curves or predefined filters, Sublime lets you measure retention based on real business context. You can compare how long customers stick around after buying a bestseller vs. a discounted bundle. Or analyze whether customers acquired during a holiday campaign are more likely to come back than those who found you through organic search.
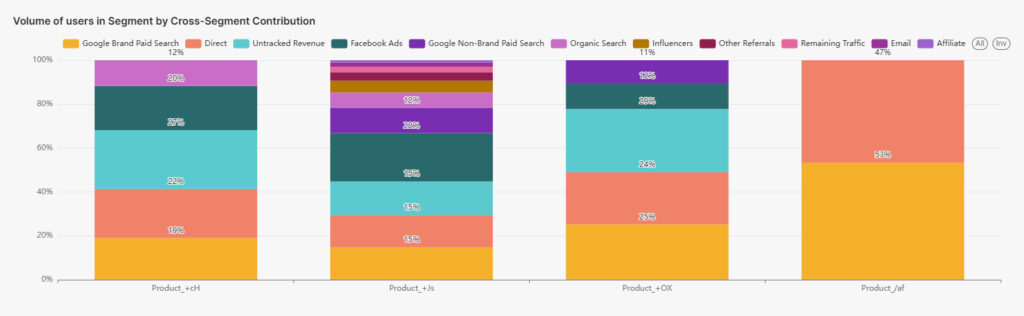
You can also explore repeat purchase timing, frequency, and churn – with retention curves that update automatically as your segments evolve. Whether you’re running loyalty programs, launching new categories, or adjusting discounting strategies, Sublime helps you understand how each move impacts long-term customer choices.